


Already using Boolytics?
Sign in to your own environment.
Data from your installation, put to work
Boolytics collects, stores and processes the data from your plant, your machines and your buildings — from a single energy monitor to a full energy management system. Industrial hardware on site, Belgian datacenters behind it, open standards throughout, and the option to grow from monitoring into active control.
It grew out of what Boolean does every day: industrial automation and PLC programming. That makes it deliberately not a generic IoT platform. The same controller that measures a production line or a building today can steer it tomorrow — peak avoidance, battery and PV control, climate control — without replacing the hardware.
Steer
- Alarms and threshold-based automatic actions
- Load balancing and peak avoidance
- Secure remote control of connected assets
- Scales from pure monitoring to full plant or building control
Two layers, one platform
On site: an industrial gateway
A Beckhoff PLC in your own installation collects the measurement and control data, scaled to the job — from a compact unit to a configuration with several decentralised I/O islands.
Industrial hardware rather than consumer equipment, for four reasons: higher reliability and a longer service life; parts and long-term support that stay available for years; the same hardware can actively steer the installation later, not just measure it; and the architecture is extensible, so new meters and protocols get added without starting over.
It connects over your own Ethernet network, or over a 4G router when you would rather keep it off the company network entirely. If the connection to the datacenter drops, data is buffered locally. Nothing is lost.
In the datacenter: the Boolytics cloud
A Tier III datacenter in Brussels, with a backup in a second Tier III datacenter in Belgium. Built on open standards — MQTT over TLS and Sparkplug — chosen deliberately to keep you out of vendor lock-in and to keep future integration straightforward.
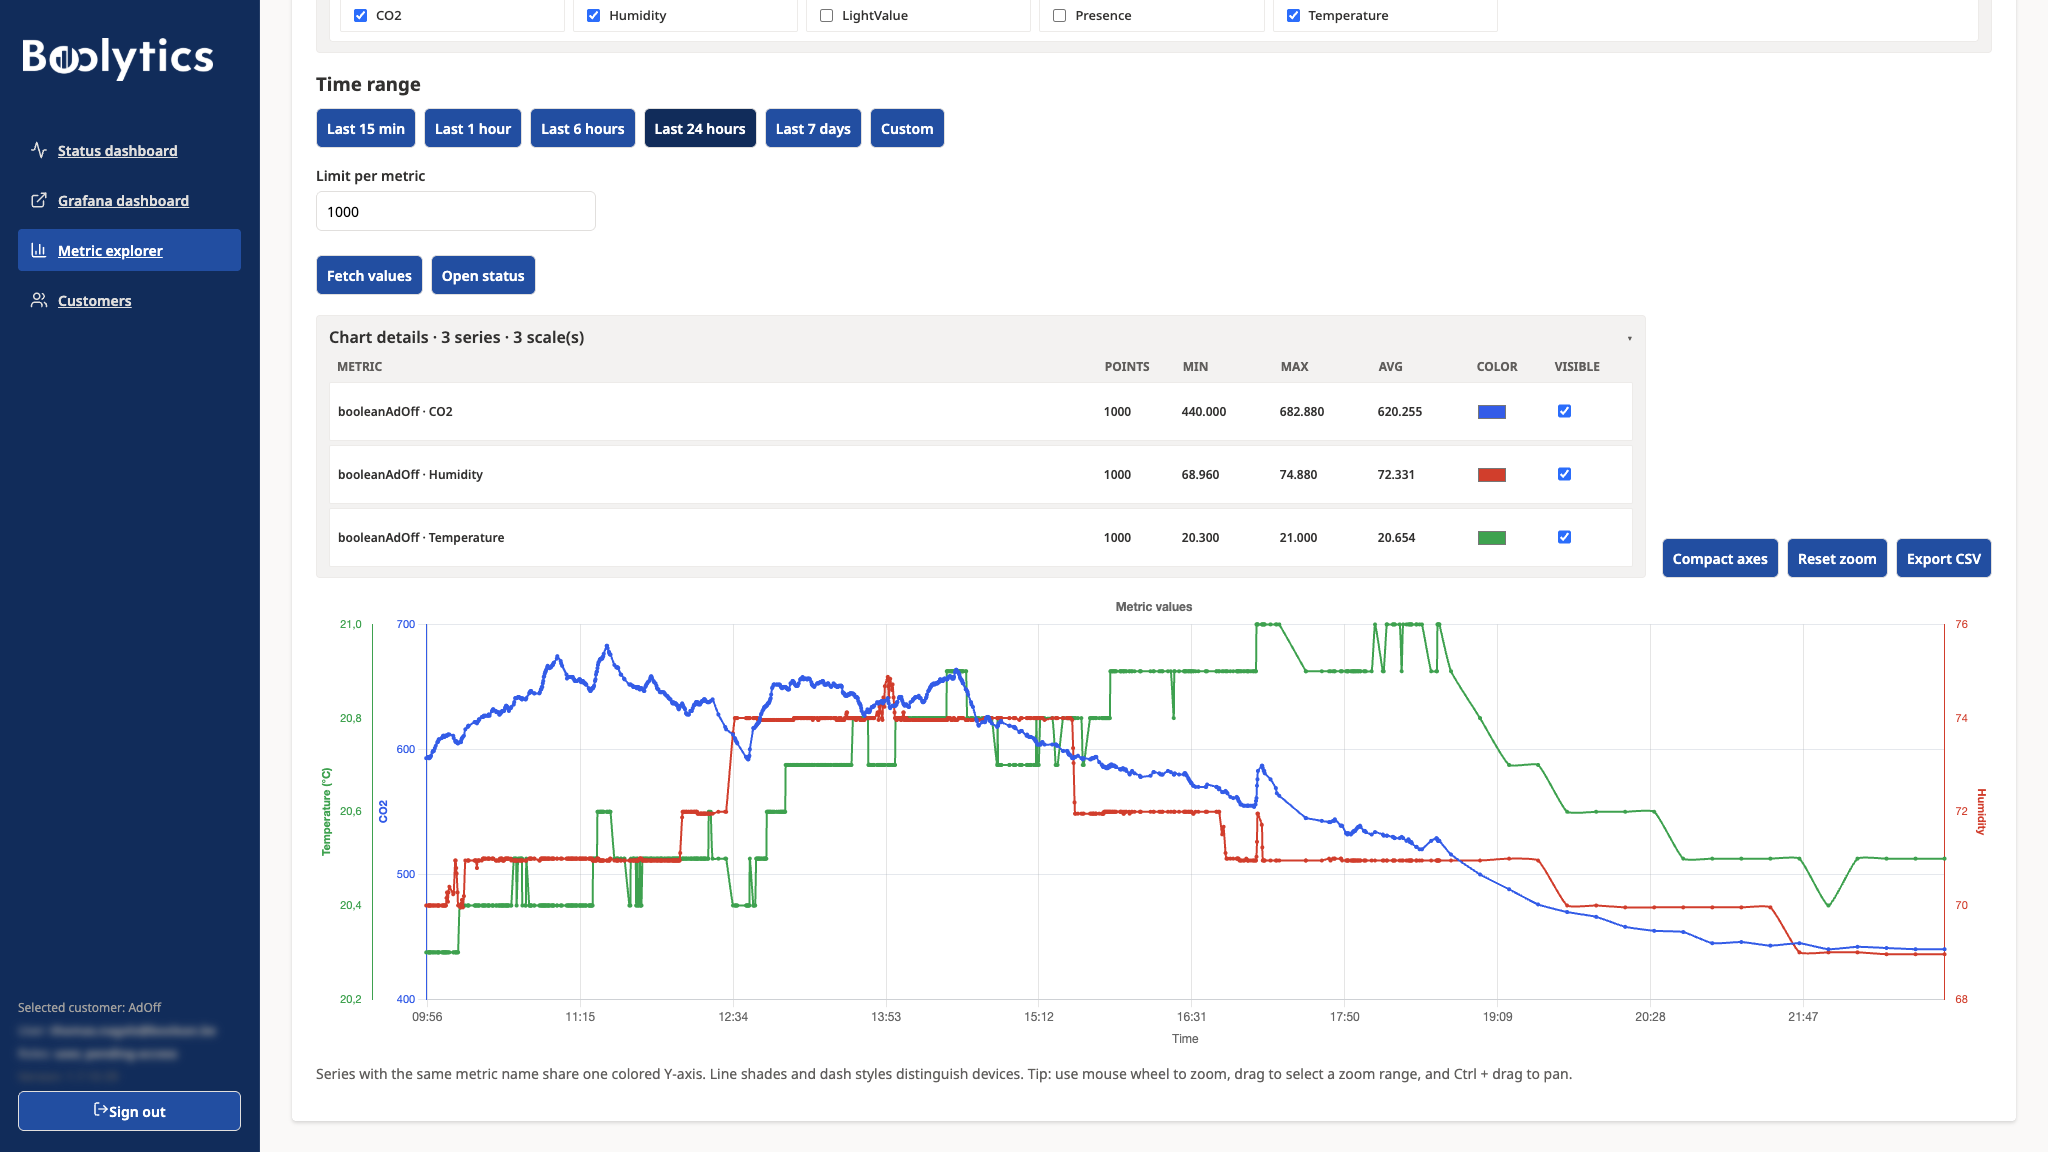
A data point every fifteen minutes by default, the same quarter-hour rhythm Fluvius works in, with extra points recorded automatically when a reading deviates further in between. Data stays available for at least two years, and raw data can be exported before anything is removed under the retention policy.
Not limited to electricity, either: water, pressure, temperature, flow and day-ahead energy prices all land in the same place.
Machines and buildings alike
A production line and an office building look nothing alike, but underneath they are the same problem: equipment that already produces data nobody keeps. Boolytics runs on both, because in both cases it is a PLC that already speaks to the equipment. What changes is which protocols and which meters — not the architecture.
On machines and production lines
- Existing energy meters across several electrical panels, integrated rather than ripped out and replaced
- Machine and process signals — pressure, temperature, flow, water — in the same store as the electricity
- EtherCAT for decentralised I/O, Modbus TCP and RTU where your machines already speak it
- Consumption attributed per line, per panel and per asset, so a figure can actually be acted on
In buildings
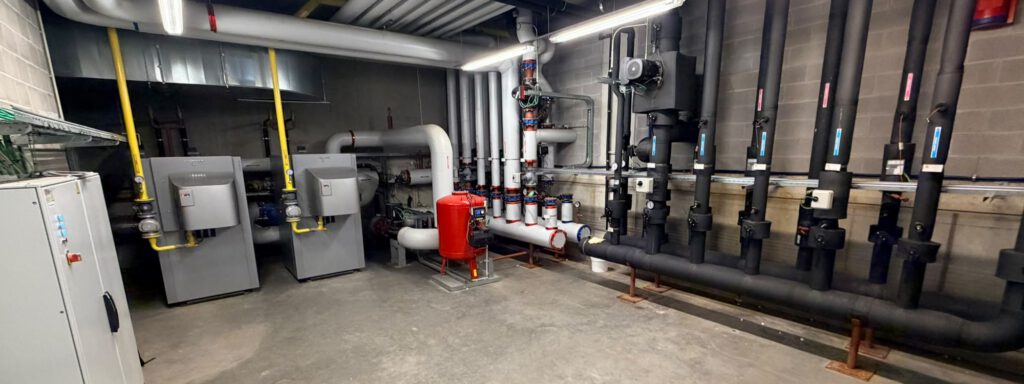
- KNX, DALI, SMI and BACnet for building automation, M-Bus for water meters, and the P1/Fluvius port
- Energy, comfort and climate in one view, across every building on a site instead of one dashboard per system
- Consumption per building, per tenant or per meter — the basis for automatic billing where that is needed
- Sits alongside Boolean’s building management system, so monitoring and control share one data layer
Your data, your rules
By default Boolytics runs in a Tier III datacenter in Belgium and your data never touches a public cloud. Need it to stay on-site, or inside the cloud environment you already run? It deploys there too, so ownership and sovereignty stay exactly where you decide.
Tier III datacenter
The default — Belgian, secure, redundant, fully managed.
On-premise
Your data stays on-site, on your own infrastructure.
Your own cloud
Deployed inside the cloud environment you already run.
How you reach your data
Boolytics is one platform, not a product line with fixed tiers. What reporting and visualisation look like is put together per project, from these building blocks:
- Periodic reporting by e-mail, in Excel or CSV, on a schedule and without a live dashboard
- A Grafana environment with a plugin for straightforward access to your own data, which you can combine with your own sources
- The full Boolytics environment — a secured login, optionally through single sign-on with Microsoft 365 or Google Workspace, with graphs per meter and export
Monitored while it runs
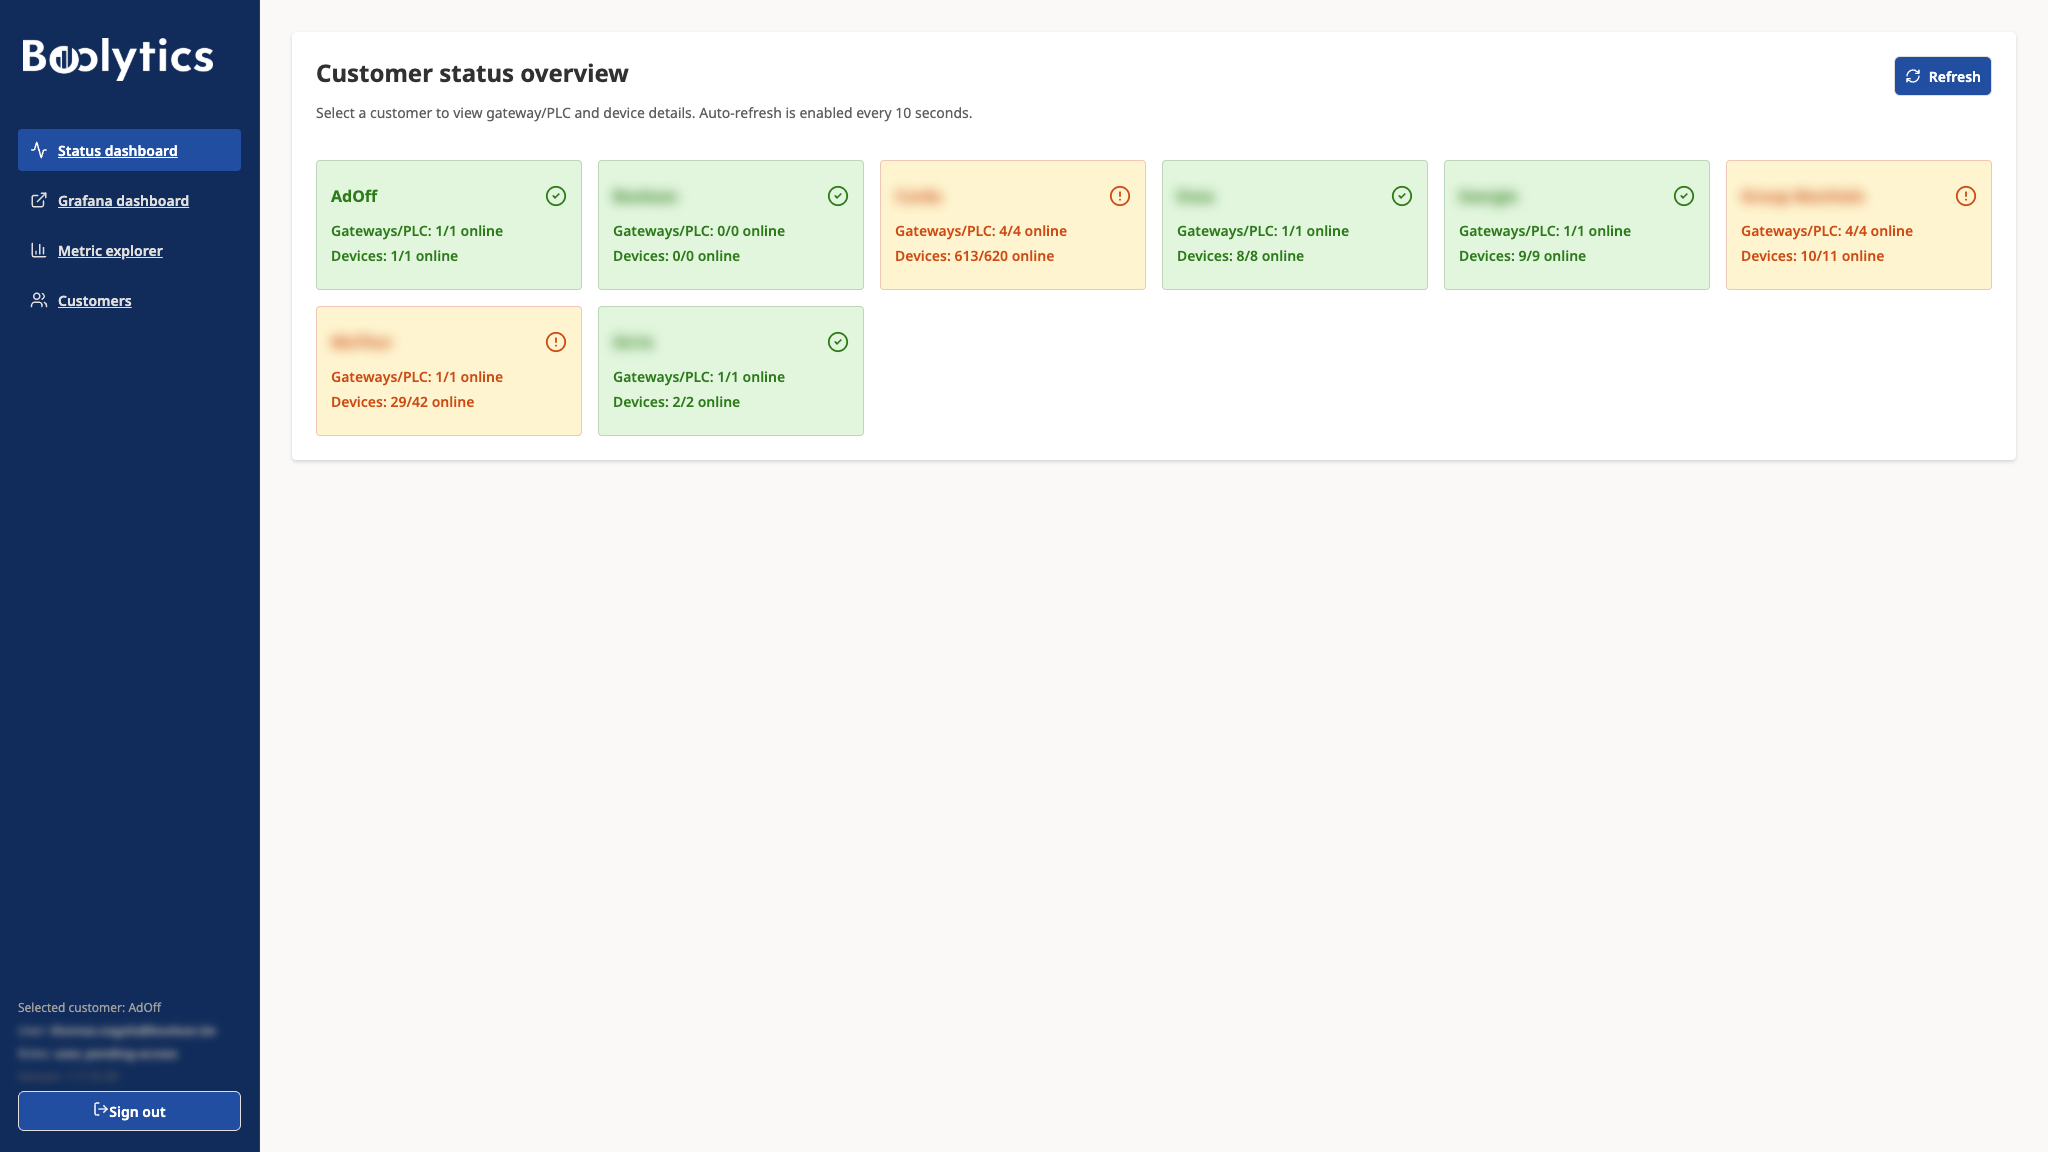
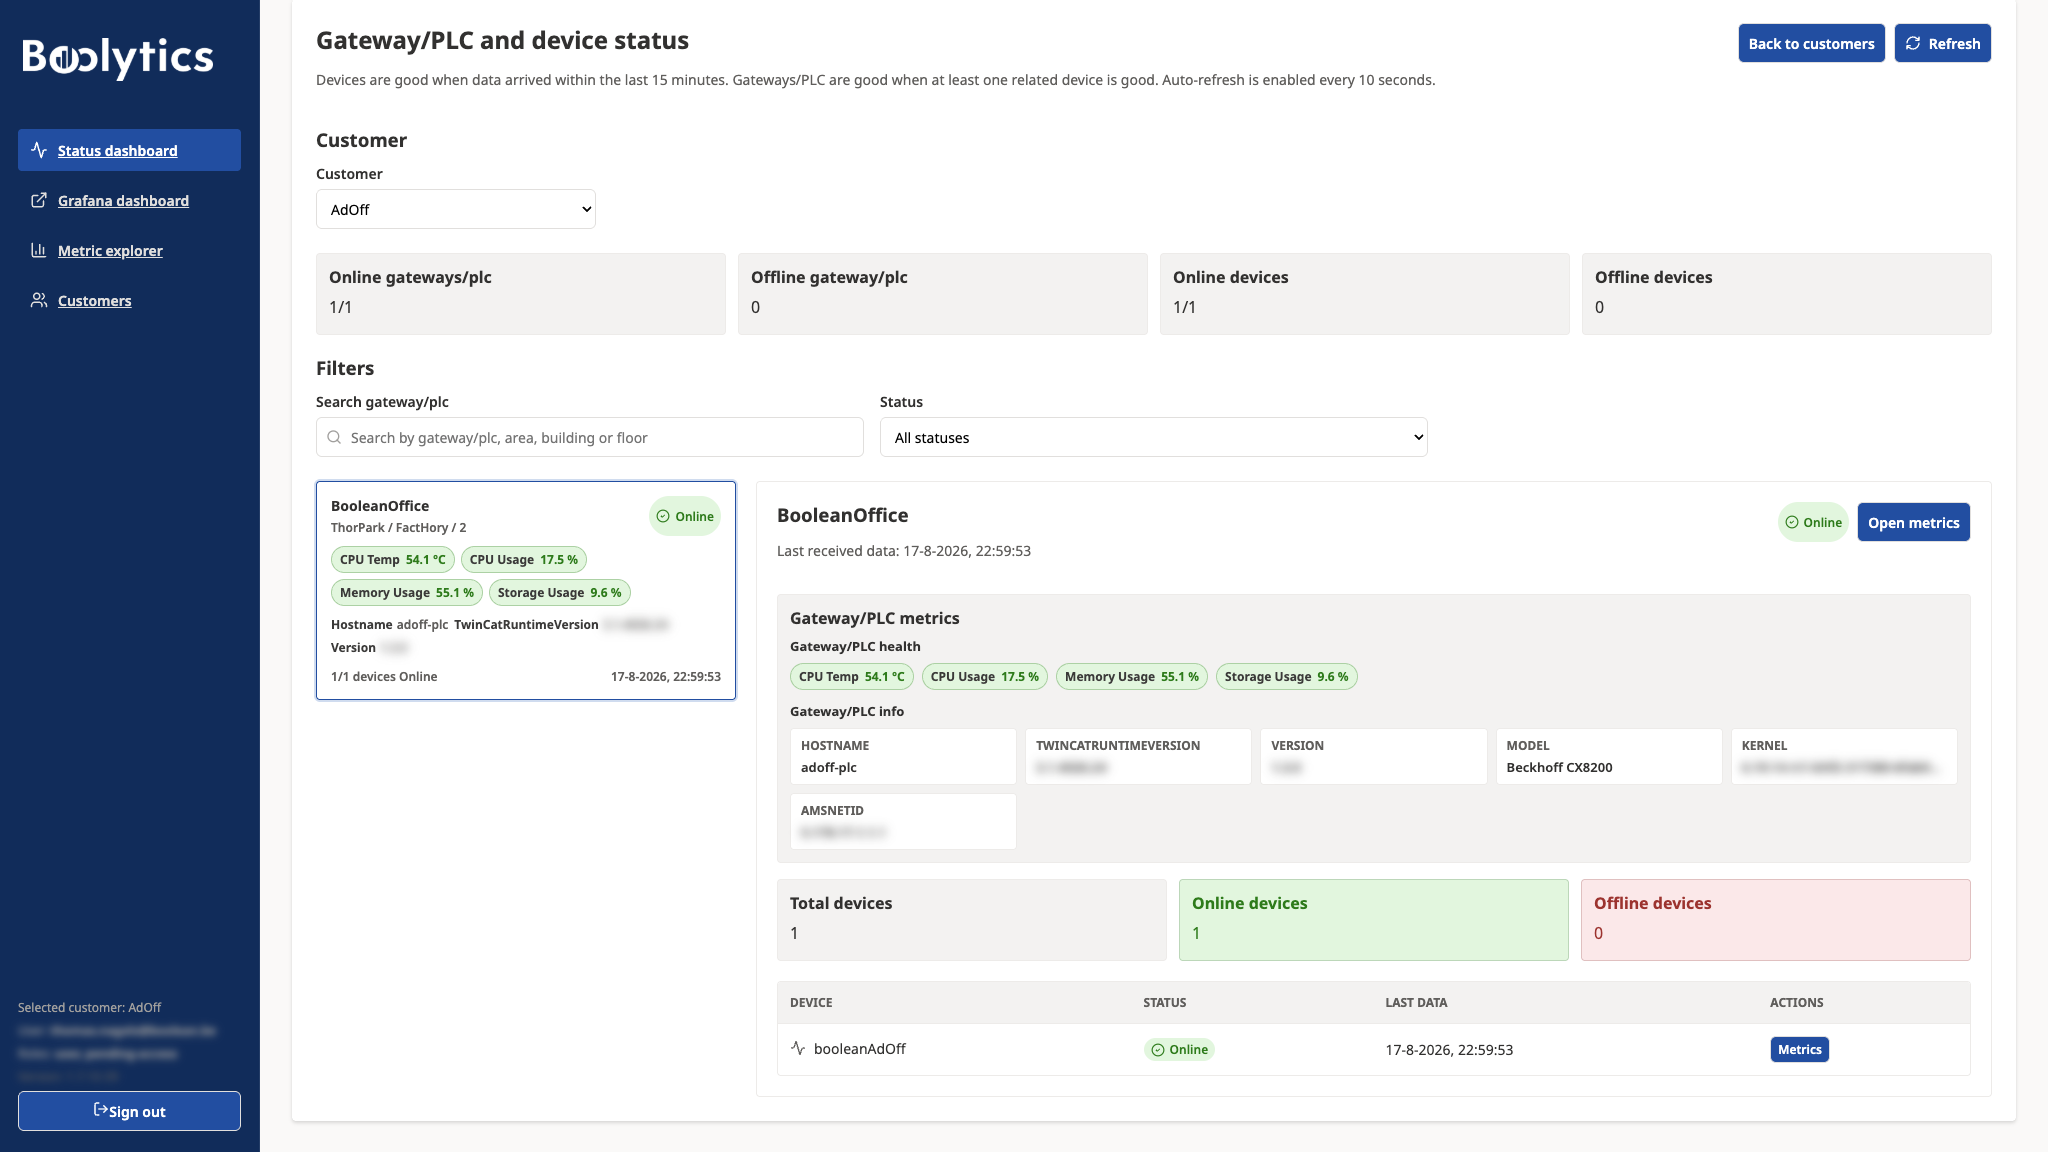
System status is monitored automatically, and our helpdesk gets an alert when something drifts or fails. A gateway that stops reporting, or a meter that starts returning nonsense, gets picked up and dealt with — not discovered months later when someone opens a report and finds a gap.
That is also why the dashboard shows the health of the measuring chain next to the measurements themselves. A number you cannot trust is worse than no number at all.
An AI agent that watches with you
A dashboard shows you what happened. Getting from there to why it happened usually means someone who knows the installation sitting down with the data. An AI agent can do that watching continuously — either ours, running locally, or one you bring yourself.
Ask your installation a question
The agent has the same data and the same system context you do: which meters exist, what the equipment is doing, what normal looks like on this site. So instead of building a query, you ask — and you get an answer that points at the measurements behind it.
- Watches the system and the data continuously, not only when someone opens a report
- Helps make sense of what is happening across meters, machines and buildings at once
- Runs on our own local agent or on an AI you already use — see below
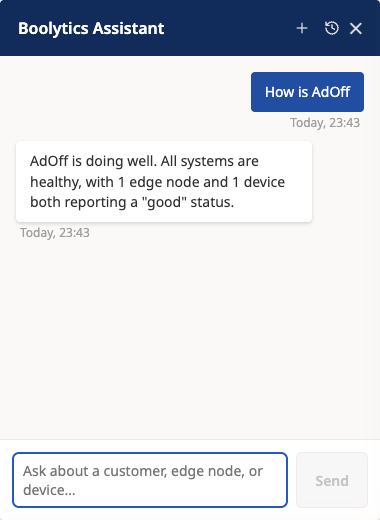
Our local agent
Runs on your own installation, next to the data. Nothing leaves for a public model, so the same data policy that covers your measurements covers the questions you ask about them.
Bring your own AI
Already standardised on a model or an assistant of your own? Boolytics is API-first, so your own AI can work from the same data and the same system context ours does.
It grows with the site
Most installations start with monitoring. The platform extends from there, on hardware that is already in place — no second investment to get from measuring to steering.
From monitoring to control
- Peak avoidance and load balancing against your own connection capacity
- Battery and PV control, with day-ahead energy prices pulled in centrally
- PV curtailment when feeding back is not the sensible option
- The control logic runs on the PLC on site, not in the cloud, so the installation keeps deciding even when the link does not
Integrations
- Fluvius data — historical figures through the Fluvius platform, real-time through a direct connection to the meter
- Facility management software over API, so figures never have to be copied across by hand
- Boolean’s own building management system when monitoring and control meet on the same site
- Your own BI, EMS or AI tooling, straight onto the API
What it costs
The price scales with the number of measurement points, not with the volume of data you generate. That keeps it easy to work out in advance, and a busy site does not get more expensive just because it has more to say.
Boolytics in the field
Where Boolytics runs today
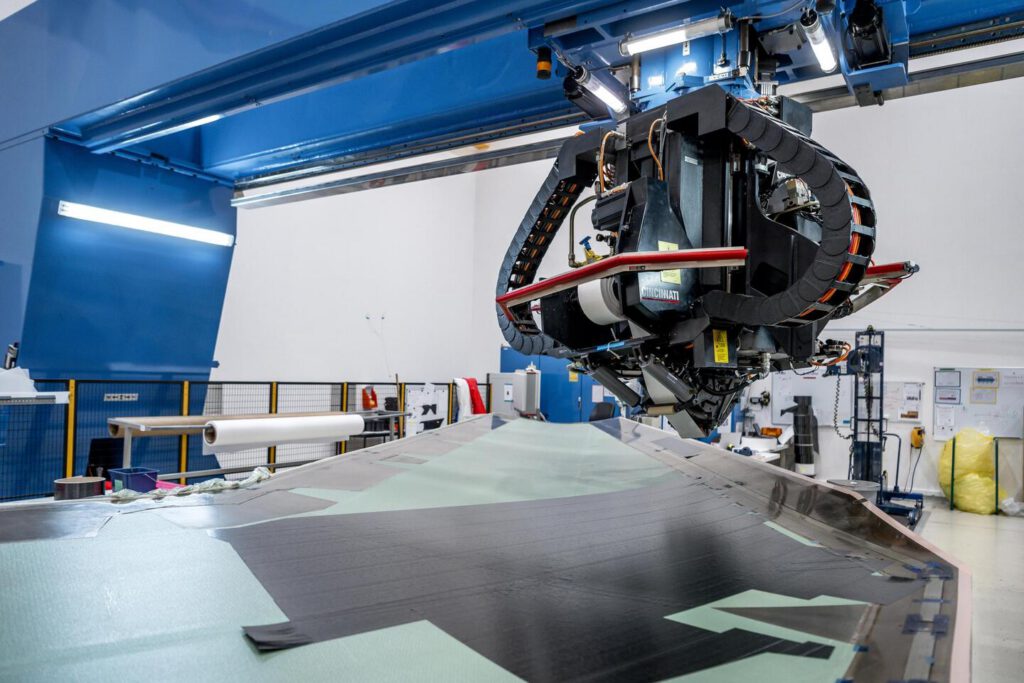
 SABCA · Performant IndustriesFrom machine to modelMachine, environment and inspection data joined in one neutral platform — so a process anomaly shows up during layup, not at final inspection.Discover the case
 ConstrucThor · Smart BuildingsReal answers for climate-neutral renovation at a unique living labFull automatic control across three renovation typologies, with every parameter overridable by hand.Discover the case
 ASL Group · Smart BuildingsA building on autopilotA climate-controlled hangar and secured tarmac access that manages and secures itself.Discover the case
 Corda Campus · Smart BuildingsEnergy under control at Europe’s largest tech campus10 buildings, 600+ meters, one data layer — automatic billing with zero manual work.Discover the case